


Gulke: The Ship Has Sailed
The views expressed are those of the individual author and not necessarily those of DTN, its management or employees.



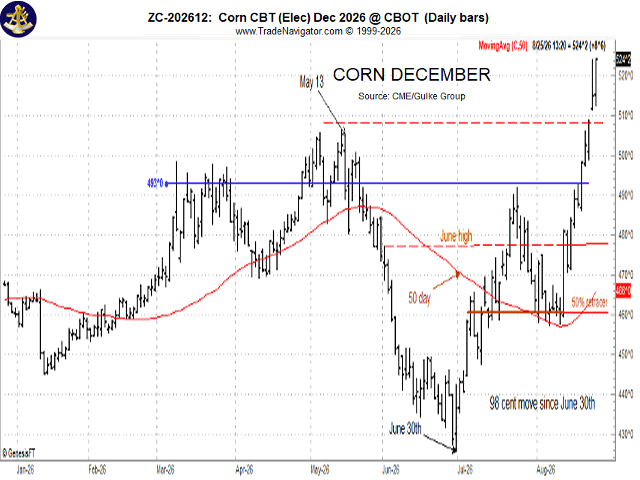
(Chart by Gulke Group)
If you haven’t benefited from the last few columns — not to mention the move from the January 2026 low, or as far back as August 2024 — then I haven’t made myself clear. It is probably too late for some to catch up now, as the ship (markets) has sailed.
The question I received most often from clients and readers of this column is: “How high will these markets go?” My answer is that it was a lot easier to pick the June 30 bottom than it will be to pick the top. Markets gave the bears all the time in the world to sell the bottom, but the top will come like a thief in the night. I have my own methodology for reducing the risk of missing the top, but I won’t address it here; that is for the studious student with an inquiring mind. We can discuss it if you so desire — just contact me.
The December corn chart (see accompanying graphic) is a repeat of last week’s. While redundant, it is worth seeing graphically what has happened — not just this week, but for the past eight months. I’ve often told my associates to stare at a price chart until it speaks loudly, or until a virtual boxing glove pops out and hits you square between the eyes with a revelation. A few bullet points:
— I have mentioned repeatedly my view that marketing changed in late August 2024 — a paradigm shift, if you will. Based on the front-month (continuous) demand chart, all three commodities — corn, soybeans, wheat — bottomed in August 2024. While there has been volatility since, that low has not been violated. Tested, yes. Successfully violated, no.
All the while, all we heard about was negative returns in agriculture. Not one word from media analysts, economists or commodity groups about the opportunities. The move in corn of $1 per bushel in 60 days has made amends for higher costs — do the math, but don’t tell the secretary of agriculture.
— The call by media gurus that the high would occur in mid-February, as it did last year, was unfounded from the start, proving that looking back to predict the future is often an exercise in futility. It is a “futures” market, and few truly understand that concept.
— All during the first five to six months of the year, I wrote about the importance of a succeeding month trading and sustaining a close above the previous month’s close. If and when that happened, I stated we’d have a bull by the horns. Study the chart: That is exactly what happened. My long-term bullish stance on agriculture over the past two years has proved out. A doubter might say, “If it weren’t for the yield problems, it wouldn’t have happened,” or chalk it all up to the war. Whatever helps justify the skeptics, so be it. It was never about the war — it was far more complicated than that, and it started before the Iranian War and even before Trump. Using any excuse is just that — an excuse, not a reason.
— Finally, look at what has happened leading up to the August WASDE report and the pre-Pro Farmer Tour. Corn was telling us something a month prior — even the week before WASDE, when it closed in July above the June highs on July 24. With the WASDE report, the Pro Farmer Tour and the realization of crop problems, August has eclipsed July as if July wasn’t even there.
All the while — as recently as last week — I heard media commentators say to wrap up old-crop sales, as we may not see those prices again. They were right, for a change, but for all the wrong reasons. Prices may not return to those levels.
OUTLOOK
Whether one uses the 173-bushel-per-acre yield estimate for corn or raises it to a more credible 178 bpa, ending stocks send a clear message: Stocks tighten considerably without China. The market will speculate on Brazil’s crop this year, and the odds favor Brazil not repeating last year’s production. You may choose not to project, but the market will extrapolate world supply figures into a supply-and-demand scenario for shock value.
That shock value is this: We would carry somewhere between 1.0 billion bushels (unrealistic) and 1.45 billion bushels into 2027-28 — roughly 500 million bushels less than on Aug. 31 of this year. Do the math; the market already is.
Odds are that calculations will show we need 3 million to 4 million more acres of corn, a couple more million acres of soybeans and at least 2 million to 3 million more acres of all wheat. Look at 2027 new-crop prices today and ask yourself whether giving up inventory beyond what is needed to cash-flow makes sense. Factor in speculation on input availability, and there is yet another story to tell.
There is nothing obvious to traders now that good, proactive analysis hadn’t already told us weeks, months or even years ago. The fact that bulls are finally coming out of the woodwork now that it is obvious to an 8-year-old concerns me — but it may all be just starting to come to light, even for those who have been like deer in the headlights, denying the validity of our price-discovery system. I doubt the government understands it at all.
If I sound politically incorrect, it is because I have seen this situation unfold before. I may have been blunt, and I apologize for that — but I am not sorry for calling out how the media has handled our agricultural economy, nor for taking to task the outlook gurus who may have misled producers. Remember: It is dangerous to take advice from buyers, or from those who have no skin in the game and are merely armchair quarterbacks skimming off the top. Sellers beware — the sharks are circling.
Jerry Gulke can be reached at (707) 365-0601 or by email at Jerry@gulkegroup.com
(c) Copyright 2026 DTN, LLC. All rights reserved.