


Gulke: Production Reduction in Future?
The views expressed are those of the individual author and not necessarily those of DTN, its management or employees.



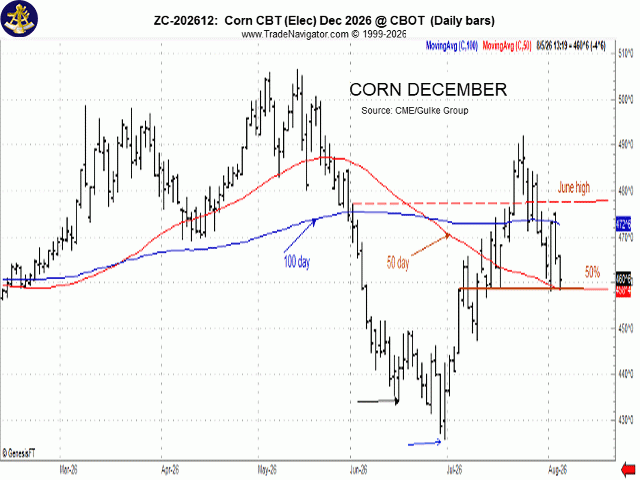
(Chart by Gulke Group)
StoneX reportedly added more uncertainty to the size of the supply side of the corn supply/demand equation with its estimates out today, at 184.8 bushels per acre (bpa). StoneX did the same thing last year and ultimately reduced yields by 2 bpa in corn by September.
There were a lot of questions on its numbers keeping phones ringing in our office today, especially regarding North Dakota, South Dakota, and even Illinois. The concerns are that any survey can be tainted by personal biases, and if elevators (buyers) were surveyed, I would have to be suspect; I find it personally questionable to take information or advice from a buyer who seeks control over my inventory.
We took a small tour of northern Illinois yesterday on our way back from our Hinsdale, Illinois, office. Our observations were not in keeping with StoneX of Illinois, nor are we on the same page in other states, including the Dakotas, where we have had direct observation recently. Comments on our findings below are taken directly out of our morning wire to clients.
Our findings were of the worst tip back and pollination just north of the city of DeKalb since perhaps 2010 — 11 and even as far back as 1988. Conditions got better from Route 72 north to the garden spot in our backyard near Rockford, Illinois. The corn crop on our worst land (timber soils) is perhaps 30-40 bushels better than the findings in DeKalb County. I’ll send some pictures if you are curious. Send a request along with your opinion/observations to info@gulkegroup.com, and we’ll send pictures.
If there was any shock and awe yesterday, it was in seeing just how badly high-quality land in Illinois got hurt. Rationale escapes me as to the reasons, as well as those of professional agronomists, but the unexpected seems to have happened. Unless we had dumb luck and randomly stopped at the poorest fields, the Illinois crop is likely 20 bushels less than last year. If the visibly obvious problem areas in one of the most productive counties in Illinois were a shock, then what of other areas downstate?
The good-to-excellent 60% rating this year plus continuous week-to-week deterioration versus last year’s 69% G/E rating gives credence to our tour results. The poor to very poor corn of 11% this year versus 9% last year gives further support that a record crop is a wild speculation. In fact, the August 2025 World Agricultural Supply and Demand Estimates (WASDE) report that raised yields to 188 bushels had written confirmation that WASDE saw all five of the major states at record yields, while this year’s crop ratings show that is not very likely.
There continue to be rumors of “crop production models” used by trading firms suggesting even better results than that of StoneX, giving uncertainty a voice in speculation for next week’s WASDE report on the minds of traders. But unless there is an AI model that can strip away shucks from the ear, count rows and kernels and plant population, I suspect we could find fault with armchair speculation. So, unless boots on the ground support theoretical observations, one has to have caution. There is an exception that haunts me in the background, however.
Market action in corn and ag commodities in general has seen a setback of some significance in the daily price changes the last six to seven days that created short-term negative bias technically. It is difficult to find a broker/analyst who now doesn’t see the potential of corn rising in price into Q1 of 2027; that concerns me, as those same entities have been bearish ag for some time, for some reason only now to see the light.
In addition, the carryover this year of nearly 2 billion bushels has to be held by someone. If the producer is still holding 2025 corn, he likely will need to sell inventory before the end of August to make room for the 2026 crop. If so, those that see further deterioration into Aug. 30 could be right in the short run.
The December corn chart reflects concern:
— Corn failed to sustain a close over the June highs during July and price subsequently retraced 50% of the total rally from June 30 to July 24 of 50 cents, or nearly a $100/acre gain on new crop and those still holding old crop.
— A 50% retracement neutralizes things a little, giving both bears and bulls a pause.
— December corn is now stuck between the 100-day average (blue line) and the 50-day average (red line), which technically shows the uncertainty in today’s fundamentals.
— Interestingly, something I don’t recall happening prior is that the averages and retracements have all converged during a post-July trading situation and ahead of a WASDE report that could hold surprises. There is a history of price deterioration during this time frame, when it doesn’t surprise happen. Augst of 2010 and 2020 come to mind.
Jerry Gulke can be reached at (707) 365-0601 or by email at Jerry@gulkegroup.com
(c) Copyright 2026 DTN, LLC. All rights reserved.