6 Fertilizer Prices See Sizeable Moves Higher
All eight major fertilizers were higher for the second week of April 2026 compared to a month earlier. Six fertilizers were significantly more expensive, which DTN designates as anything 5% or more. Four fertilizers saw double-digit price increases compared to last month.

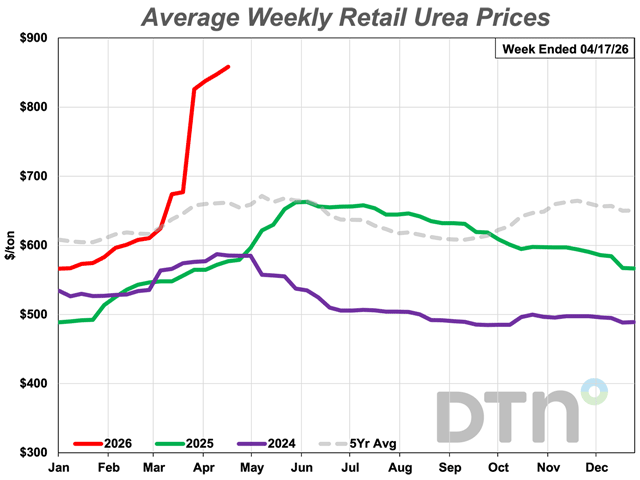
Urea was 27% higher compared to last month with an average price of $858/ton. (DTN chart)
OMAHA (DTN) — Retail fertilizer prices tracked by DTN for the second week of April 2026 continue to show rapid increases.
Six of the eight major fertilizers had considerable price increases compared to the prior month. DTN designates a significant move as anything 5% or more.
Urea led the way higher again as the nitrogen fertilizer was 27% higher compared to last month. The nitrogen fertilizer had an average price of $858/ton.
Anhydrous was 20% higher versus the prior month and had an average price of $1,114/ton. UAN32 was 19% more expensive than last month and had an average price of $579/ton.
UAN28 was 10% higher compared to last month with an average price of $520/ton. 10-34-0 was 7% more expensive with an average price of $717/ton.
Both DAP and MAP were 5% more expensive looking back a month. DAP had an average price of $894/ton and MAP $932/ton.
One nutrient was just slightly higher in price compared to last month. Potash had an average price of $491/ton.
On a price per pound of nitrogen basis, the average urea price was $0.93/lb.N, anhydrous $0.68/lb.N, UAN28 $0.93/lb.N and UAN32 $0.91/lb.N.
All eight fertilizers are now higher in price compared to one year earlier. In addition, all but two are now double digits more expensive.
Potash is 5% higher, 10-34-0 is 9% more expensive, MAP is 13% higher, DAP is 15% more expensive, UAN32 is 29% higher, UAN28 is 37% more expensive, anhydrous is 43% higher and urea is 49% more expensive looking back to last year.
DTN gathers fertilizer price bids from agriculture retailers each week to compile the DTN Fertilizer Index. DTN first began reporting data in November 2008.
In addition to national averages, MyDTN subscribers can access the full DTN Fertilizer Index, which includes state averages, here: https://www.mydtn.com/agriculture/web/ag/markets/fuels-fertilizers#!/fertilizers.
A new survey from the American Farm Bureau Federation (AFBF) released last week shows farmers have felt the negative effect of high input prices, especially fertilizer prices. You can read about here: https://www.dtnpf.com/agriculture/web/ag/crops/article/2026/04/15/5-fertilizers-significantly-cost-ago.
| Dry | ||||
| Date Range | DAP | MAP | POTASH | UREA |
| Apr 14-18 2025 | 781 | 822 | 467 | 577 |
| May 12-16 2025 | 794 | 825 | 469 | 630 |
| June 9-13 2025 | 805 | 832 | 474 | 656 |
| July 7-11 2025 | 810 | 847 | 481 | 658 |
| Aug 4-8 2025 | 822 | 892 | 484 | 646 |
| Sep 1-5 2025 | 860 | 913 | 487 | 632 |
| Sep 29-Oct 3 2025 | 906 | 921 | 483 | 609 |
| Oct 27-31 2025 | 927 | 931 | 487 | 598 |
| Nov 24-28 2025 | 925 | 923 | 489 | 590 |
| Dec 22-26 2025 | 866 | 884 | 484 | 567 |
| Jan 19-23 2026 | 843 | 863 | 482 | 574 |
| Feb 16-20 2026 | 852 | 880 | 487 | 608 |
| Mar 16-20 2026 | 851 | 886 | 487 | 677 |
| Apr 13-17 2026 | 894 | 932 | 491 | 858 |
| Liquid | ||||
| Date Range | 10-34-0 | ANHYD | UAN28 | UAN32 |
| Apr 14-18 2025 | 656 | 781 | 380 | 448 |
| May 12-16 2025 | 666 | 777 | 412 | 484 |
| June 9-13 2025 | 669 | 773 | 418 | 495 |
| July 7-11 2025 | 672 | 769 | 417 | 501 |
| Aug 4-8 2025 | 669 | 765 | 421 | 498 |
| Sep 1-5 2025 | 667 | 767 | 415 | 481 |
| Sep 29-Oct 3 2025 | 666 | 813 | 419 | 465 |
| Oct 27-31 2025 | 666 | 843 | 412 | 466 |
| Nov 24-28 2025 | 667 | 865 | 417 | 466 |
| Dec 22-26 2025 | 674 | 863 | 409 | 466 |
| Jan 19-23 2026 | 665 | 856 | 409 | 464 |
| Feb 16-20 2026 | 665 | 862 | 412 | 465 |
| Mar 16-20 2026 | 671 | 931 | 473 | 489 |
| Apr 13-17 2026 | 717 | 1114 | 520 | 579 |
Russ Quinn can be reached at Russ.Quinn@dtn.com
Follow him on social platform X @RussQuinnDTN
(c) Copyright 2026 DTN, LLC. All rights reserved.