Gulke: The Fact Sheet Comes to Roost
The views expressed are those of the individual author and not necessarily those of DTN, its management or employees.
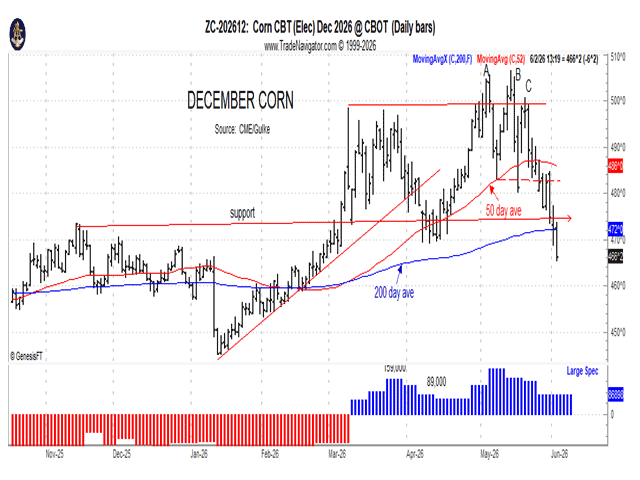
A look at December corn futures movement. (Chart by Gulke Group)
After the dust settled and analysts who had been bullish on the Xi-Trump summit read the details of the meeting’s fact sheet, U.S. commodity markets fell with a vengeance. As of Tuesday’s close — measuring from the May 13 top to the June 2 low — July and December corn futures have fallen more than 40 cents; July and November soybeans have fallen 70 cents and 38 cents, respectively; and July Chicago and Kansas City wheat have fallen more than 80 cents, with Minneapolis down 94 cents.
Use whatever yield you want: The dollar loss eclipses the rise in fertilizer prices — and perhaps even the increased cost of fuel to plant the crops. The bears who had called for a repeat of last year’s mid-February high were wrong, and they likely converted to bullish believers right on schedule as President Donald Trump sat down to the banquet in China — right on cue for the traditional May 13-15 seasonal high.
Excuses are running rampant now as analysts scramble to find a fundamental reason for the collapse, but those explanations fall short given the damage done to already-thin profit margins. It remains difficult to find a land-grant university or commodity group — including co-ops — that kept a meaningful focus on market outlook. Perhaps the surprise capitulation reflects a lack of due diligence more than outright error; the door didn’t seem wide enough to let bears turn bullish and then bearish again within a matter of days.
A few updates to bring us current:
GRAIN INSPECTIONS (exports leaving the U.S.) continue to show steady, solid corn demand. Yet since prices topped on May 13, old-crop corn is down 45 cents, and new-crop corn is down 40 cents. Old-crop soybeans are down 60 cents from the high, and new-crop soybeans are down 30 cents from the high — though on a closing basis, they are up 18 cents. Wheat is off nearly 80 cents. More troubling: There are no new-crop soybean sales on the books yet. China is absent so far.
TECHNICALLY, corn, soybeans and wheat all essentially topped on May 13. July corn is now trading below its March-April-May lows, and December corn has exceeded those lows to the downside. Short-term sell signals were posted during the first two weeks of May and have since turned the medium-term weekly outlook bearish for old- and new-crop corn and wheat. New-crop soybeans have not yet triggered that signal but will do so on a close below $11.70 — either this week or next. The long-term monthly charts still show some life, but the ease of this short-term capitulation is concerning.
I have written about the paradigm shift in agriculture that began Aug. 30, 2024, and lasted roughly 18 months into early March 2026. Longer-term trend changes typically run about 18 months — long enough to span two marketing years. The China summit may have brought this one to an end. Regardless, it is still hard to watch the economic malaise unfold, knowing how much harder it will be to climb that wall a second time.
WEATHER remains confusing, with striking variability between wet and dry areas. Markets are cheering drier conditions that allow planting to advance, while parts of northern Illinois and the Northern Plains have received only a quarter to a half inch of rainfall over the past six weeks. The moisture situation may be the worst since 1988 — but rain is in the forecast. Markets are forward-looking by 10 to 14 days and have been pricing in an anticipated weather improvement.
CROP CONDITIONS. The first crop conditions report of the season, released Monday, showed corn rated good to excellent at 2 percentage points below last year, while soybeans in that category came in 1 percentage point below a year ago. Crop progress, meanwhile, remains ahead of last year’s pace. Current conditions likely matter little except to the novice trader prone to overreacting to early-season data.
BIOFUEL FEEDSTOCKS. Soy oil and canola are posting new 2026 highs. According to USDA’s Fats & Oils report, April soybean crush came in at 6.553 million tons, above the 6.44-million-ton estimate. April soybean meal stocks stood at 347,686 tons, down from 401,567 tons the prior month. April ending soy crude oil stocks were 2.443 billion pounds, above the 2.37-billion-pound estimate. Even so, that market has been overshadowed by the broader selloff in other agricultural commodities.
SINCE THE AUG. 24, 2024, LOW — the capitulation that marked the paradigm shift — July corn futures are up 80 cents ($160 per acre), soybeans are up $2.20 ($110 per acre) and Chicago wheat is up $1.10 per bushel. That is true even after the collapse since May 13.
PREDICTING A BOTTOM is like trying to catch a falling knife. I learned decades ago that day-to-day prices are a challenge to navigate but are critical to staying proactive. We watch markets daily and respect the importance of price discovery. While May 13 may have caught many producers and analysts off guard, odds are the same thing will happen at the next turn higher. If you were caught long and wrong, it may be time to listen to a better drummer. The December corn chart accompanying this week’s column speaks volumes.
Jerry Gulke can be reached at (707) 365-0601 or by email at Jerry@gulkegroup.com
(c) Copyright 2026 DTN, LLC. All rights reserved.