


Gulke: Time/Price
The views expressed are those of the individual author and not necessarily those of DTN, its management or employees.



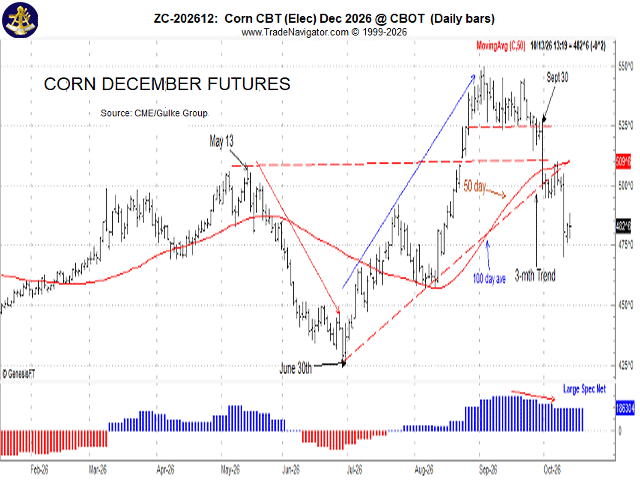
(Chart by Gulke Group)
Soybean harvest is progressing rapidly, while corn has a good deal left. So far, reported yields are all over the place, often varying by 10 bushels in soybeans and 30 to 40 bushels in corn, even within the same field. That raises questions about how yields were predicted earlier this year, including by the Pro Farmer Crop Tour and, most recently, the NASS boots-on-the-ground report last Friday that surprised the trade.
With as much disappointment as is being voiced by farm organizations, farmers themselves and traders, one has to assume many were caught leaning the wrong way, including speculators. While the numbers may have been a surprise, the result should not have been such a surprise. Time and price action (technicals) appear to have been proactive again. The December corn chart accompanying this week’s column reveals just that. Much of what is shown has been discussed in this column over the past nine months.
— The May 13 top held until June 30, when price again became attractive.
— The importance of the May 13 high was punctuated by a price gap above the May 13 high that needed to hold to keep the two-year bull market alive. It did so until Sept. 2, when the market topped.
Note that it topped at the same time it bottomed in each of the previous two years.
This coincided with the bullish Pro Farmer Crop Tour results and a media narrative, referenced by two popular writers-turned-analysts, that featured a podcast excited about higher prices and even an acreage war next year because production would not be sufficient to meet demand. Some even thought $7 corn would be needed to ration demand.
— The market spent the whole month of September anticipating the Board of Trade meeting between Chinese President Xi Jinping and U.S. President Donald Trump.
— The market was naive to think the meeting would be anything more than a progress report. There was little, if anything, Trump had to complain about, as China was living up to its 25-million-metric-ton soybean agreement. The trade was disappointed, and the rest is history.
— Corn prices fell below the September lows and below the May 13 high, both signals that the party was over. Even the Sept. 1 gap was filled, in contrast to the upside gaps of the previous two years that did not get filled.
This week’s lows need to hold, and next week’s price action will be key to the six-month outlook for corn. Soybeans need to hold $12.50 on a weekly basis if there is hope left for a post-harvest recovery.
Unfortunately, wheat posted a 1-2-3 top, and 2027 acres are likely to rise 10%. Chicago wheat is still up $1.75 per bushel year over year, despite recently losing a dollar. Soybeans are up $2.25 year over year. Corn actually rallied $1 per bushel from the Sept. 30 lows before topping in early September, when expectations were that corn would three-peat and bottom in September for the third straight year. Only the Chicago Bulls did that, not the CME bulls!
Do the math. Prices are well ahead of last year despite all the media hype about diesel fuel, as the talking heads continue to major in minors. There are some subtle messages embedded in the chart accompanying this column that should be obvious by now. One is the tendency for large speculative positions to coincide with market tops. Yet there has been a lot of discussion about that and very few recommendations to react. If your adviser seems like a deer in the headlights this year, maybe it’s time to call us.
(c) Copyright 2026 DTN, LLC. All rights reserved.